September Newsletter I Know What You Did Last Summer
Last summer, the Federal Reserve continued its efforts to squash inflation, raising its policy rate an additional 300 bps over the past 12 months. Yet the inflation bogeyman stalked investors for much of the year despite significant progress – the U.S. annual inflation rate is anticipated to slip below 4% by year-end, a far cry from the 8% rate experienced in 2022.
Look no further than Canada to see past rate hikes' impact. The Bank of Canada (BoC) noted that activity has “entered a period of weaker growth” led by a “marked weakening” in consumption growth. Additionally, the Bank flagged slowing household credit growth due to the impact of higher rates.
Sighting slower growth, the BoC held its key lending rate at 5%. Slower growth equals further progress on the inflation front, which is a net positive for equities.
The Bank has tended to lead the Fed this cycle, and if this sequence remains, this week’s decision to keep the Canadian overnight lending rates on hold may be a precursor of what is ahead for U.S. policy rates.
Bottom Line: We are in the early stages of the Goldilocks scenario outlined in our July webinar (click here to request a copy of the Goldilocks Zone). We expect that a peak in rates will play out nicely for bond and dividend-focused investors.
While progress has been made on the inflation front, Fed Chair Powell’s speech at the annual Jackson Hole Economic Symposium was measured and revealed little new insight.
Although he recognized improvements on the inflation front, he emphasized the need for further progress, indicating that the central bank stands ready to tighten policy again.
We fully expect officials to remain steadfast in their language and commitment to bringing inflation toward target unless there is a significant negative economic shock that would require a dramatic shift in policy.
“Central banks would rather deal with a recession than the damaging impacts of persistently high inflation. So, despite the progress to date, we don’t expect central banks to declare victory anytime soon, contrary to the evidence that clearly shows they are winning the battle.” ~ Are We There Yet August Newsletter
Over the past few weeks, there has been plenty of economic data to support our view inflation is continuing to moderate, most notably the slowdown in the U.S. labour market.
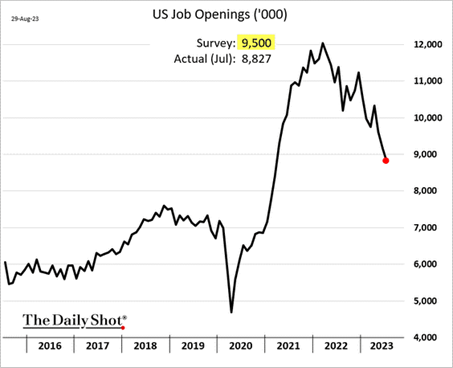
The July Job Openings and Labor Turnover Survey (or JOLTs report) showed there were just 8.8 million job openings, the first sub-9 million print since March 2021.
As the number of job openings slipped to the lowest level in more than two years, the number of people quitting their jobs – an indicator traditionally closely associated with labour market strength as it shows workers are confident they can find a better wage elsewhere – also plunged by 253,000 to just 3.5 million (after tumbling 265,000 in May), the lowest since February 2021.
A drop in JOLTs implies the labour market may finally be getting less tight, and if that’s the case, it will make the Fed more confident that inflation isn’t a long-term problem, which implies rates have likely peaked.
JOLTs – Job Openings Slip to a Two-Year Low
Shortly after the JOLTs report, the official U.S. employment report (non-farm payrolls) helped to support the cooling narrative. The unemployment rate ticked up three full notches to 3.8%, well above consensus expectations of 3.5% and its highest rate since early 2022.
Job gains rose to 187,000, slightly ahead of consensus but not high enough to worry the market.
The likely reason is the significant downward revisions to the past reports in every month this year. With the final June revision published, this year's payrolls have been overstated by 240,000. To put that in perspective, 240,000 is approximately equivalent to one entire month of employment gains!
Over the next several months, the key for the markets will be that economic activity continues to cool, but not so much to point to an outright economic contraction.
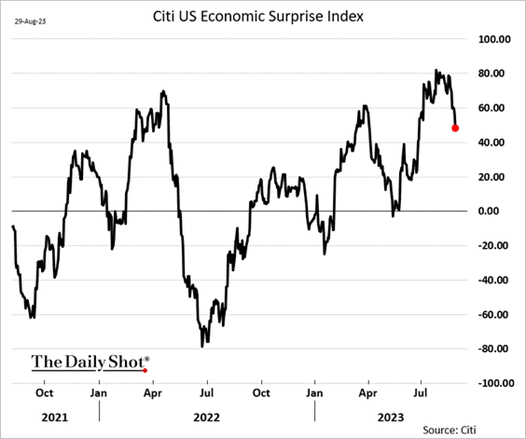
The U.S. Citigroup Economic Surprise Index is currently pointing to this outcome, as data has been slightly weaker than economist estimates.
U.S. Economic Surprise – Data a Little Softer
Bottom Line: The labour market has been a significant concern for the Federal Reserve as it attempts to bring inflation towards target. The employment slowdown is welcome news on the inflation front, but too much will increase worries of an economic recession in 2024.
Why So Glum Chum?
Apparently, corporate America didn’t get the message that economic conditions are cooling. S&P 500 ‘23 bottom-up earnings estimates bottomed in July at $218.02 and have ticked higher to $220.49.
Markets are forward-looking, so they are more concerned about what earnings will look like in 2024. As of August 23, the S&P 500 ‘24 estimate ticked higher to $246.78, or about 12% yoy earnings growth.
S&P 500 ‘24 Earnings Per Share Estimate Over Time
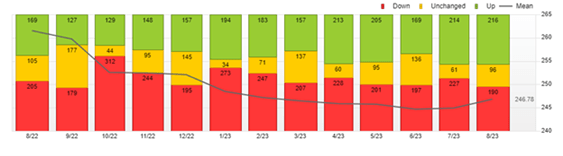
Source: Factset
Bottom Line: The soft landing narrative has legs for the remainder of the year – cooling economic conditions while corporate earnings remain resilient. However, we are monitoring for a shift in this narrative amid this year’s interest rate hikes, which will increasingly weighing on the economy.
Sentiment Setup
We had written that investor sentiment had become overly bullish in August and expected a near-term pause in the market’s upward momentum.
“The near-term bullish read could make markets vulnerable to a pullback; however, we would need a catalyst and with quarterly corporate earnings coming in better than expected, the more likely scenario is a pause in the upward price action.” ~ Are We There Yet August Newsletter
After the S&P 500 and S&P/TSX finished down 1.5% and 1.6%, respectively, in August, sentiment has reset, thus setting the market up for the seasonal year-end trade.
As illustrated below, as of August 2, the AAII Investor Sentiment Survey showed 49% of investors were bullish. This bullish sentiment has receded to just 32% as of August 23.
AAII Investor Sentiment – Contrarian Indicator; Investors Less Bullish
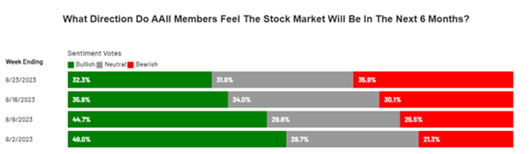
Source: AAII Investor Sentiment Survey
Seasonal Setup
Seasonality is a bit of voodoo magic; however, if conditions remain favourable (the Goldilocks period we’ve been discussing for the past few months), we anticipate markets will follow their typical seasonal pattern.
From a seasonality perspective, August and September are the two worst months of the year, using data going back to 1971. The typical seasonal pattern would suggest September weakness, particularly in the later part of the month, followed by a strong Q4.
Now for the voodoo magic. If we isolate the years when the S&P 500 is already up double digits YTD, the average performance during September has been a gain of 0.4%, with positive returns ~60% of the time.
Typical Seasonal Pattern – Past 20 Years
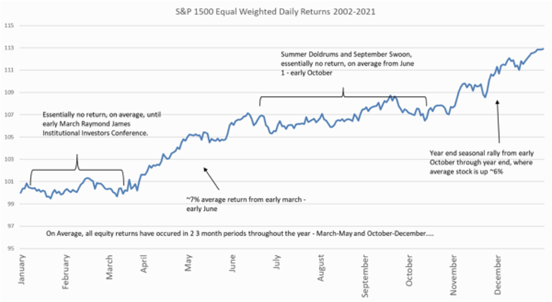
Source: Raymond James Financial
Bottom Line: Sentiment has reset, and as long as conditions remain favourable, we are entering the seasonally strong period for equity markets.
Charts of Interest
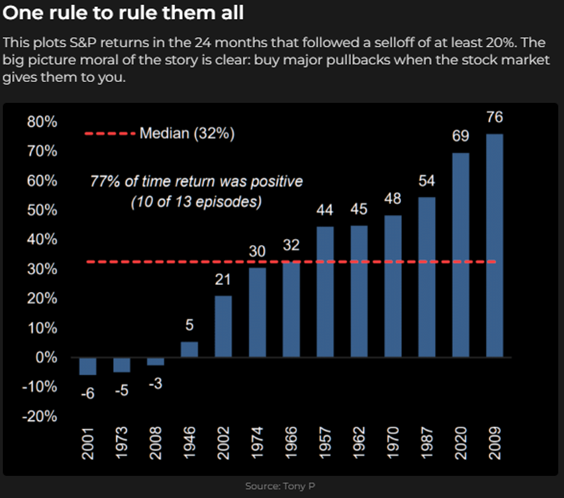
One rule to rule them all. Focus on the long run and take advantage of periods of weakness.
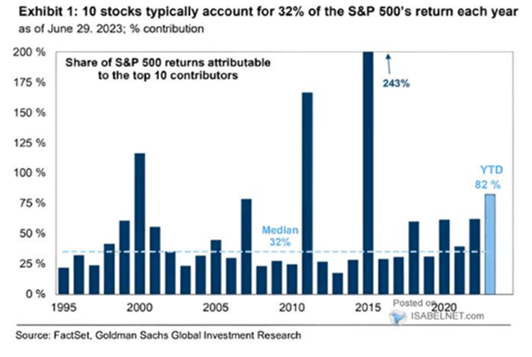
Magnificent Seven is driving much of this year's return, but it's not that unusual an event for the S&P 500 as the top 10 stocks typically account for 32% of annual return, on average.
This newsletter has been prepared by the Cadence Financial Group and expresses the opinions of the authors and not necessarily those of Raymond James Ltd. (RJL). Statistics, factual data and other information are from sources RJL believes to be reliable but their accuracy cannot be guaranteed. It is for information purposes only and is not to be construed as an offer or solicitation for the sale or purchase of securities. This newsletter is intended for distribution only in those jurisdictions where RJL and the author are registered. Securities-related products and services are offered through Raymond James Ltd., member-Canadian Investor Protection Fund. Insurance products and services are offered through Raymond James Financial Planning Ltd., which is not a member-Canadian Investor Protection Fund. This provides links to other Internet sites for the convenience of users. Raymond James Ltd. is not responsible for the availability or content of these external sites, nor does Raymond James Ltd endorse, warrant or guarantee the products, services or information described or offered at these other Internet sites. Users cannot assume that the external sites will abide by the same privacy policy which Raymond James Ltd adheres to. Recommendation of the above investments would only be made after a personal review of an individual’s financial objectives. Securities-related products and services are offered through Raymond James Ltd. Insurance products and services are offered through Raymond James Financial Planning Ltd.
Raymond James (USA) Ltd. advisors may only conduct business with residents of the states and/or jurisdictions in which they are properly registered. Investors outside the United States are subject to securities and tax regulations within their applicable jurisdictions that are not addressed on this site. Raymond James (USA) Ltd. is a member of FINRA/SIPC.
Website legal disclaimers
Raymond James Ltd. is an indirect wholly-owned subsidiary of Raymond James Financial, Inc.
Securities-related products and services are offered through Raymond James Ltd., member Canadian Investor Protection Fund.
Insurance products and services are offered through Raymond James Financial Planning Ltd, which is not a member Canadian Investor Protection Fund.
Raymond James Trust Services are offered by Raymond James Trust (Canada) in the provinces of British Columbia, Alberta, Saskatchewan, and Ontario, and by Raymond James Trust (Québec) Ltd. in the province of Québec. Both entities are wholly owned subsidiaries of Raymond James Ltd. Trust Services are not covered by the Canadian Investor Protection Fund. Use of the Raymond James Ltd. website is governed by the Web Use Agreement | Client Concerns.
Raymond James (USA) Ltd. All rights reserved.
Raymond James (USA) Ltd. advisors may only conduct business with residents of the states and/or jurisdictions in which they are properly registered. Investors outside the United States are subject to securities and tax regulations within their applicable jurisdictions that are not addressed on this website.
Raymond James (USA) Ltd. is a member of FINRA/SIPC.
![]()
This website may provide links to other internet sites for convenience of users. Raymond James (USA) Ltd. is not responsible for the availability of content of these websites, nor does the firm endorse, warrant or guarantee the products, services, or information described or offered by these other internet sites. Users cannot assume that these websites will abide by the same Privacy Policy that Raymond James (USA) Ltd. adheres to.
© 2024 Raymond James Ltd. All rights reserved. Member IIROC / CIPF | Privacy Policy | Web Use Agreement
