Don’t Go Chasing Waterfalls
Don't go chasing waterfalls
"Don't go chasing waterfalls
Please stick to the rivers and the lakes that you're used to
I know that you're gonna have it your way or nothing at all
But I think you're moving too fast"
~ TLC
We are on the fourth iteration of the reopening of trade; with this, companies stand to benefit from a return to normalcy. This theme, a back to reality, was the focus of our February 1 market update webinar that we hosted. If you missed it, you can watch the recording here (password gzW0&Y&&).
For the past two years, COVID has picked market winners and losers. One early winner was Peloton (PTON-US), which gained a staggering 600%+ from the pandemic lows to its peak in January 2021; they were among some of the unicorns (billion-dollar technology companies with no earnings) that drove Cathie Wood's Ark Innovation ETF (ARKK-US).
By mid-2020, PTON looked like a no-brainer pandemic darling, as millions were denied access to their "regular" gym workout routine. Yet on the other side of the coin, the pandemic laid waste to the US health and fitness industry by closing nearly a quarter, or 9,100, health and fitness clubs over the last 24 months, according to the industry group advocate IHRSA, The Global Health & Fitness Association.
Fast-forward to 2022, and the money-losing at-home fitness maker has gone from pandemic darling to a reopening duckling. At the height of Peloton-mania, its market capitalization reached $42.8 bln. Twelve months later, three-quarters of its market value has been wiped out.
One's loss is another's gain, and in this instance, returning to normalcy has brightened the outlook for the beleaguered fitness industry.
As we return to our new reality, the survivors who weathered the storm are now poised to recapture a lost audience. For example, Planet Fitness (PLNT-US) held up remarkably well during the darkest days of the pandemic. It used its financial strength to consolidate, recently completing the acquisition Sunshine Fitness, which added 114 locations. PLNT club count has grown at a compound annual growth rate of 20% since 2011, and it now boasts an estimated 2,440 locations across five countries, according to FactSet.
One's Loss is Another's Gain – PTON vs PLNT
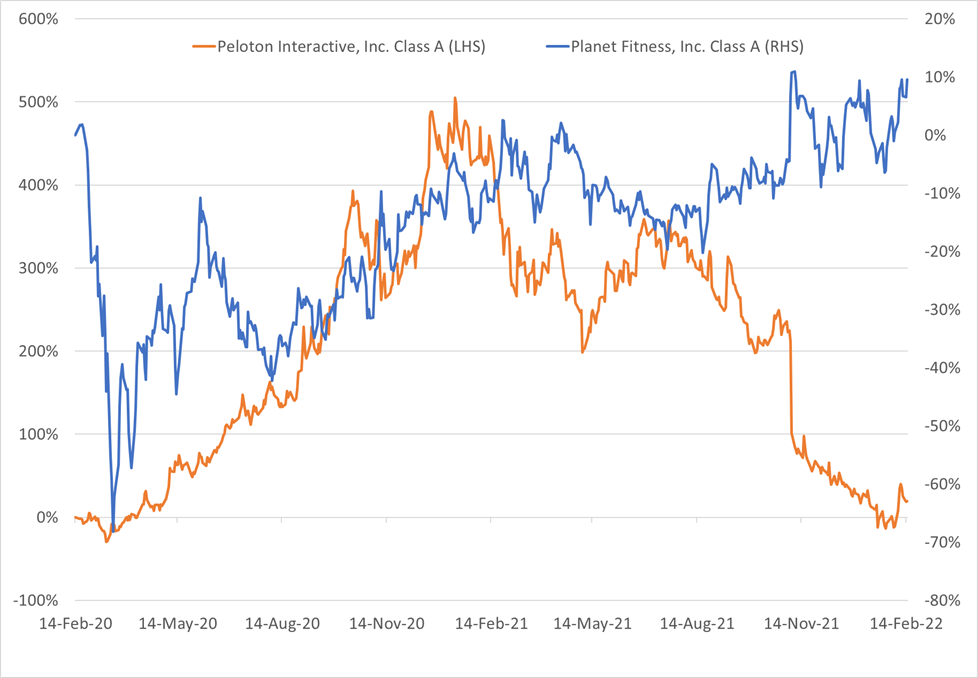
Source: FactSet
We don't own Planet Fitness, but its story speaks to our pursuit to own bullet-proof companies that can not only withstand the eye of a hurricane but can exit in a position of strength.
Don't Go Chasing Unicorns
Peloton and Cathie Wood's Ark Innovation ETF (ARKK-US) are highly correlated (0.85), meaning that each security tends to move in the same direction and at the same time.
The magnitude of the peaks and valleys are much more significant for PTON compared to ARKK, but oddly, they've both arrived at similar total returns 24 months later.
Two Peas in a Pod – PTON vs ARKK
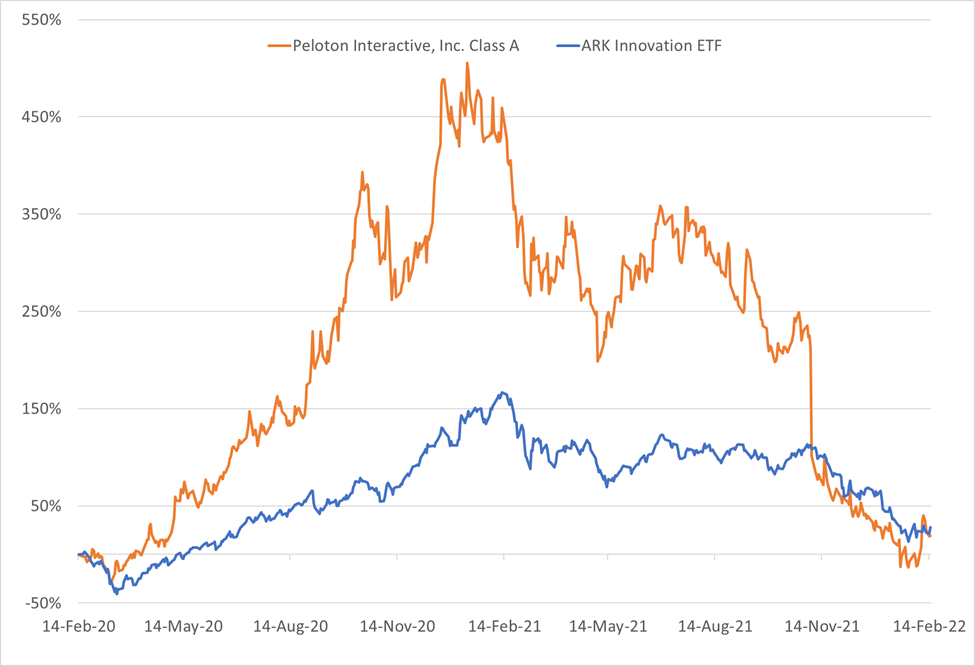
Source: FactSet
The ARKK ETF offers investors exposure to disruptive technologies at their infancy, such as EVs, cryptocurrencies, biotechnologies and the metaverse.
Unfortunately, most ARKK investors bought into the ETF at its height in 2021, offering them an investment amusement ride of volatility and painful paper losses.
The roller coaster ride illustrates the risks of investing early in secular themes that may take many years to play out.
As the chart above illustrates, there are many paths one can take to arrive at the same destination, but even better to depict this is the next chart.
The Tortoise and the Hare
What is the better performing security over the last 24 months – ARKK or Berkshire B shares (BRK.B-US)?
The Steady Eddie tortoise approach beat the hare on a price return basis, as BRK.B advanced 40% versus ARKK gaining 28%.
As Warren Buffett famously said, "price is what you pay, value is what you get," implying that price and value are not always one and the same.
Chalk Another on up to Slow and Steady Wins the Race – ARKK versus BRK.B
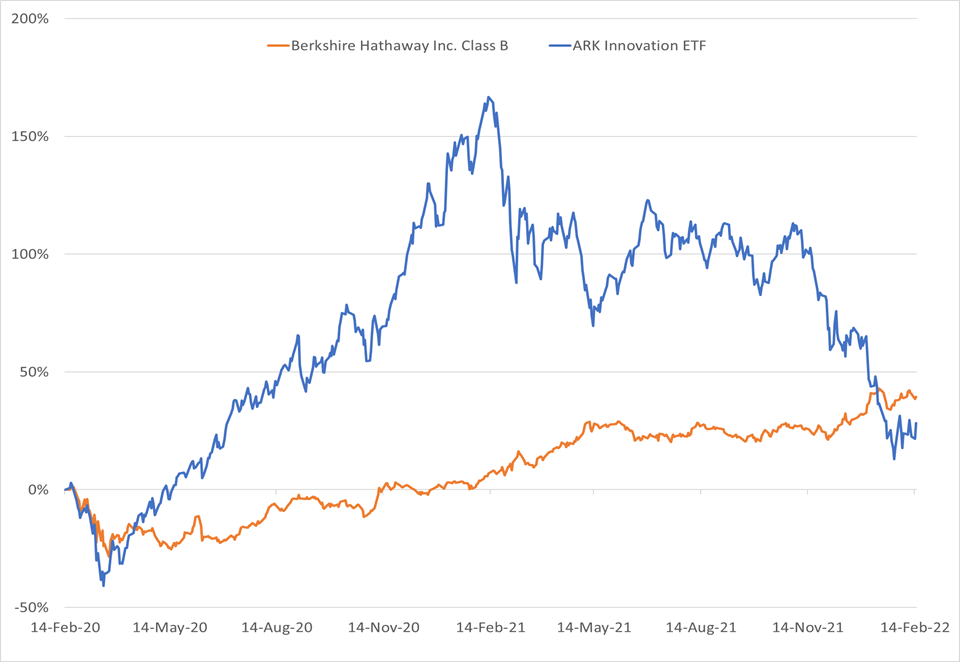
Source: FactSet
In the short-term, value can be distorted by noise, the classic seeing the forest for the trees scenario.
Facebook (FB-US) – now Meta Platforms – is a good example of the short-term clouding the long-term outlook. FB is far from a unicorn, it generates US$118 bln in revenue and US$40 bln net income, but the market punished the social media giant this month for shifting its focus to the metaverse.
We initially allocated capital to FB based on its sheer scale (3 billion active monthly users), attractive valuation and long-term growth prospects.
However, FB's strategic shift will weigh on near-term growth as it spends boatloads of money for a future pot of gold at the end of a metaverse rainbow.
We believe FB will ultimately be one of the metaverse winners, but investors dislike uncertainty. The negative price action will override the fundamentals case for owning the stock in the near term.
As such, it is in the penalty box for now. Thus, we reduced or eliminated the position across our portfolios.
The metaverse is a secular trend that we believe will change the way we interact, work and play. An immersive online world will create additional winners and losers; the challenge is identifying when there is value and when to sit on your hands.
We had thought FB represented "the rivers and the lakes that you're used to". But the markets, at the moment, is saying we're apparently "chasing waterfalls".
We think the market will ultimately be wrong, but there is no sense standing in front of a steamroller.
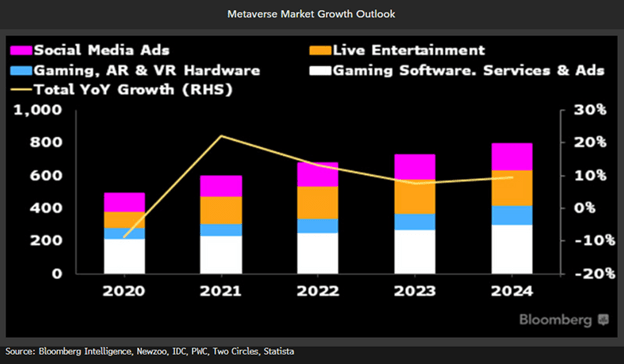
Charts of Interest
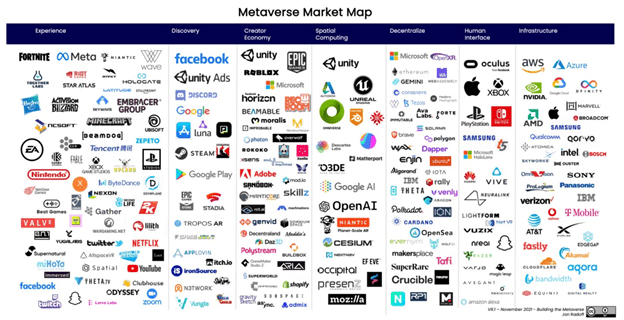
The metaverse market may reach $783.3 billion in 2024 vs. $478.7 billion in 2020, representing a compound annual growth rate of 13.1%, based on our analysis and Newzoo, IDC, PWC, Statista and Two Circles data.
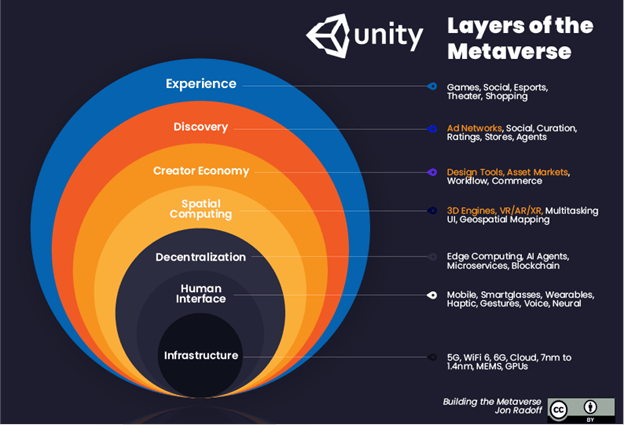
Value-chain of the metaverse and multiple layers of the metaverse onion.
Website legal disclaimers
Raymond James Ltd. is an indirect wholly-owned subsidiary of Raymond James Financial, Inc.
Securities-related products and services are offered through Raymond James Ltd., member Canadian Investor Protection Fund.
Insurance products and services are offered through Raymond James Financial Planning Ltd, which is not a member Canadian Investor Protection Fund.
Raymond James Trust Services are offered by Raymond James Trust (Canada) in the provinces of British Columbia, Alberta, Saskatchewan, and Ontario, and by Raymond James Trust (Québec) Ltd. in the province of Québec. Both entities are wholly owned subsidiaries of Raymond James Ltd. Trust Services are not covered by the Canadian Investor Protection Fund. Use of the Raymond James Ltd. website is governed by the Web Use Agreement | Client Concerns.
Raymond James (USA) Ltd. All rights reserved.
Raymond James (USA) Ltd. advisors may only conduct business with residents of the states and/or jurisdictions in which they are properly registered. Investors outside the United States are subject to securities and tax regulations within their applicable jurisdictions that are not addressed on this website.
Raymond James (USA) Ltd. is a member of FINRA/SIPC.
![]()
This website may provide links to other internet sites for convenience of users. Raymond James (USA) Ltd. is not responsible for the availability of content of these websites, nor does the firm endorse, warrant or guarantee the products, services, or information described or offered by these other internet sites. Users cannot assume that these websites will abide by the same Privacy Policy that Raymond James (USA) Ltd. adheres to.
© 2024 Raymond James Ltd. All rights reserved. Member IIROC / CIPF | Privacy Policy | Web Use Agreement
