September MMS - Looking for Greener Days
Green Day's Wake Me Up When September Ends was released in June 2005. Twelve months later, the Fed fund rate peaked. Finding where short-term interest rates will eventually peak is the key to the market. Perhaps Green Day offers the answer sometime mid-next year.
There was no shortage of data to inform the potential path for interest rates. All eyes were on global central banks as nine rate decisions were announced, the climax being the U.S. Fed's rate decision on Wednesday.
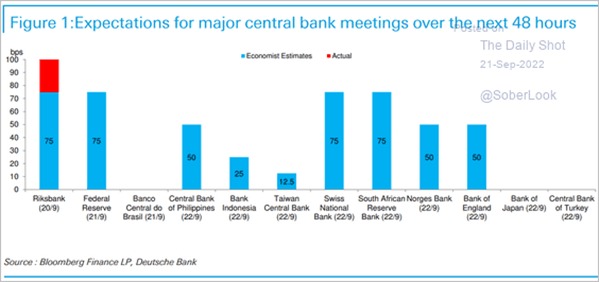
Busy Week for Central Bankers
Ahead of the meets, the bulls and bears jostled for position resulting in a volatile month.
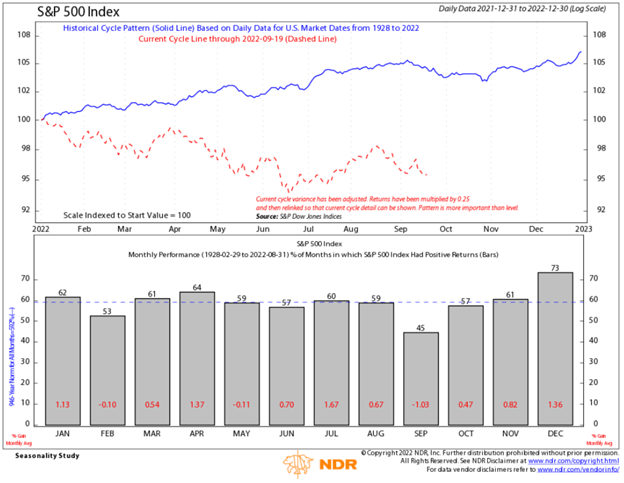
September has historically been volatile and often the weakest, producing an average return of -1.03 per cent. So, September is living up to its reputation. You can caulk this month's volatility up to the usual suspect: inflation.
Wake Me Up When September Ends - S&P 500 Historical Monthly Returns
Cooling, but Not Cool Enough
Ahead of the all-important inflation data released on September 13th, traders aggressively positioned for a significant dip in the price index, so when the report failed to deliver, traders were caught offside.
As these aggressive bets were unwound, the S&P 500 slipped 4.3 per cent, its largest daily percentage move since March 20, 2020. And just like that, the positive momentum built over the prior six trading days was largely erased.
The disappointing inflation print pushed the September Fed rate hike expectation to a full one per cent. The day after, the producer price index (PPI) pointed to an easing in inflationary pressures. Expectations edged back to a 75-bps hike, which the Fed delivered.
Follow the Dots
Ultimately, markets have struggled this year because we don't know where and when the Fed funds rate will peak.
The peak in rates can only be determined once we have explicit evidence inflation is easing and will eventually return toward target.
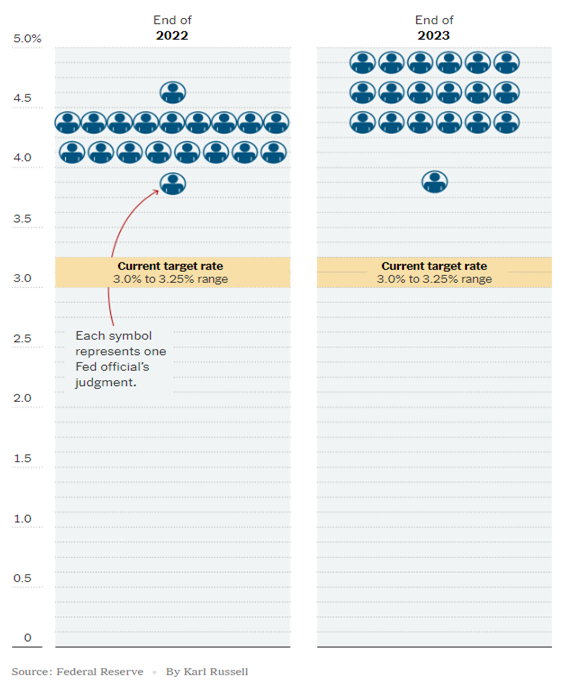
The Fed's best guess, otherwise referred to as the Dot Plot, shows a median of 4.4 per cent for 2022 and 4.6 per cent for the 2023 year-end projection.
This implies another 75 bps move in November, followed by a 50 bps in December and a final 25 bps move in 2023.
The dots on the chart below illustrate each regional Fed head's year-end interest rate forecast, and the yellow highlighted area is the current Fed funds rate.
Fed Projects More Rate Hikes Ahead
Very One-sided
Rate hikes take time to work their way through the economy. The Fed has always said it wanted to frontload the rate hikes to fight inflation and see how the plan is working.
And frontload they did. In six months, the Fed funds rate has jumped 300 bps! The last hiking cycle started in 2015 and took four years and a cumulative 225 bps of increases. In 2004, we saw 425 bps over two years.
We're now at the point where the first couple of hikes this year will begin impacting economic activity and inflation, which could be the positive catalyst we need.
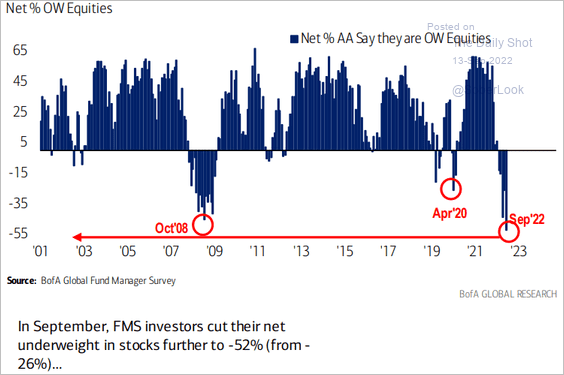
Very few investors are positioned for things to go right. Bearish sentiment among investors is at an extreme. Recall bearish sentiment in July, when the market bottomed, was also extremely poor.
It's very rare the herd gets it right. The contrarian in us is screaming buy.
Investors Are Very Underweight Equities
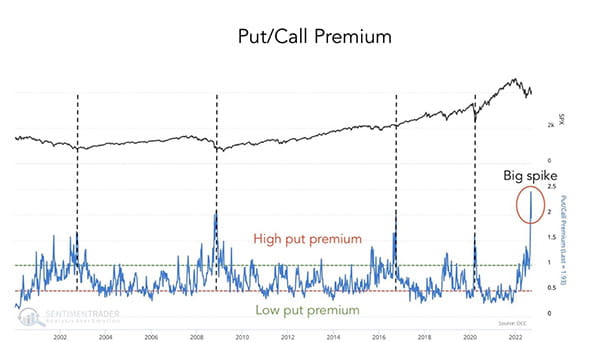
Another way to look at the extreme sentiment is the put/call premium that has spiked off the charts.
Investors buy puts when they think the market will fall and buy calls when they believe the market will advance.
As illustrated in the chart below, there are often significant premiums on puts near market lows.
Investor Paying Up for Protection
Source: Game of Trades
Ultimately, no one knows what the future holds, including the bulls and bears among us. This has always been the case, which is why diversification is the only real key to success in long-term investing.
However, when everyone is betting on one side, and there is the slightest glimmer of hope for brighter days, it can unleash a powerful counter-trend.
The ingredients are there. We just need inflation to cooperate.
Portfolio Update
By investing in solid businesses, in varying degrees, we're looking for singles and doubles, not home runs in the Cadence portfolios. This is even more true today, given the economic backdrop's unprecedented, complex, and sometimes contradictory nature.
We have patiently dripped the portfolio's cash into the market – the cash position now hovers around 10 per cent. We have done some profit-taking (yes, you can still make money in these challenging markets) to make way for two new high-quality companies and a new fixed-income manager.
- Brookfield Asset Management (BAM.A). BAM is a best-in-class alternative asset manager with a leading position in infrastructure. Over the past year, BAM's successful period of fundraising will meaningfully add to fee-earning assets, revenue, and margin in the coming quarters. The company has a long track record of generating shareholding value creations, as the stock has easily outperformed the S&P/TSX by a wide margin.
- Intact Financial Corp. (IFC). IFC is Canada's largest property and casualty insurer, offering investors one of the best growth profiles in its broader peer group, thanks to strong top-line growth driven by market share gains, M&A, and premium increases. With 20 per cent market share of the Canadian P&C insurance market, IFC's share is more than double its closest competitor. Its significant presence, greater scale, and profitability have allowed IFC to earn industry-leading ROE and generate among the best returns of the large-cap Canadian Financials since its IPO in 2004.
- After taking profit on WSP Global (WSP) earlier this year, we re-added to the position following their quarterly results that point to a strengthening demand outlook and upside to margins from productivity and efficiency gains.
- PH&N High Yield Bond Fund. The PH&N High Yield Fund provides core conservative corporate bond exposure with an attractive income characteristic and less risk than the high yield asset class. Lead Manager Hanif Mamdani has a strong track record delivering above benchmark returns across time periods (including a positive 2008) - superior risk-adjusted returns through multiple economic cycles.
To fund the purchases, we took profit on the positions below but continue to maintain a less weighting in each:
- Bristol Myers Squibb (BMY-US) shares slipped below a near-term price level that we believe indicated the shares might be rangebound.
- Canadian Pacific Railway (CP). The railway has performed exceptionally well during this period of uncertainty. However, valuation levels are at the higher end of the historical average, suggesting that the near-term upside may be capped.
Final Thoughts
Navigating the compressed rate hiking cycle and elevated inflation has created one of the most challenging investment environments in our careers.
For the first time in nearly 40 years, we also don't have the Fed acting as a natural tailwind for risk assets. Understanding and incorporating this with one's investment strategy will be the key to success.
While challenges persist, we remain solidly steadfast in our goal of achieving the outcome you expect.
Charts of Interest
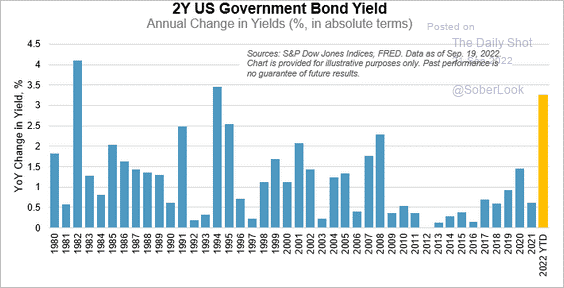
It's been decades since we've seen such a sharp increase in the two-year Treasury yield.
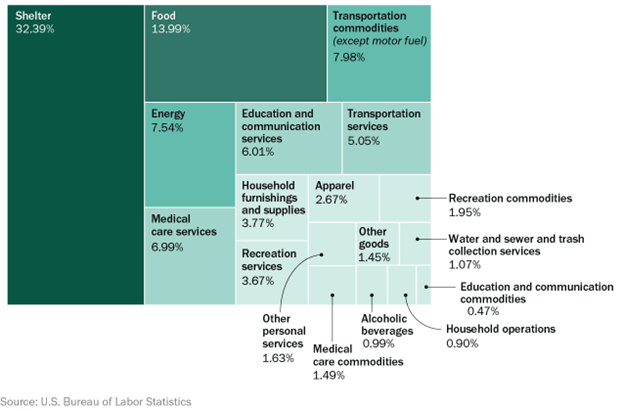
Drivers of inflation 2022 inflation composition.
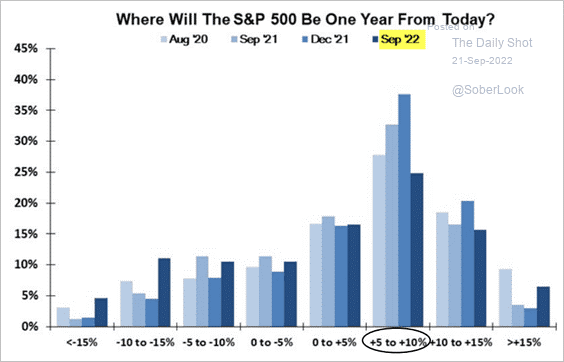
Where will the S&P 500 be a year from now? Here is a survey from Evercore ISI.
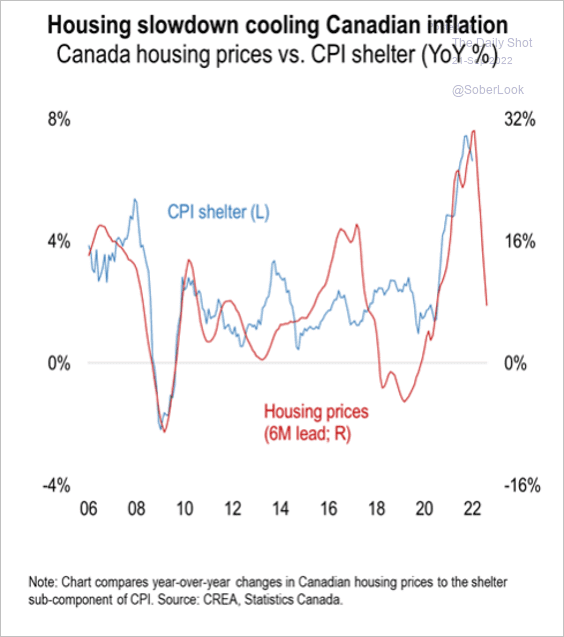
The Canadian housing market is cooling, which is helping to ease inflationary pressures.
Website legal disclaimers
Raymond James Ltd. is an indirect wholly-owned subsidiary of Raymond James Financial, Inc.
Securities-related products and services are offered through Raymond James Ltd., member Canadian Investor Protection Fund.
Insurance products and services are offered through Raymond James Financial Planning Ltd, which is not a member Canadian Investor Protection Fund.
Raymond James Trust Services are offered by Raymond James Trust (Canada) in the provinces of British Columbia, Alberta, Saskatchewan, and Ontario, and by Raymond James Trust (Québec) Ltd. in the province of Québec. Both entities are wholly owned subsidiaries of Raymond James Ltd. Trust Services are not covered by the Canadian Investor Protection Fund. Use of the Raymond James Ltd. website is governed by the Web Use Agreement | Client Concerns.
Raymond James (USA) Ltd. All rights reserved.
Raymond James (USA) Ltd. advisors may only conduct business with residents of the states and/or jurisdictions in which they are properly registered. Investors outside the United States are subject to securities and tax regulations within their applicable jurisdictions that are not addressed on this website.
Raymond James (USA) Ltd. is a member of FINRA/SIPC.
![]()
This website may provide links to other internet sites for convenience of users. Raymond James (USA) Ltd. is not responsible for the availability of content of these websites, nor does the firm endorse, warrant or guarantee the products, services, or information described or offered by these other internet sites. Users cannot assume that these websites will abide by the same Privacy Policy that Raymond James (USA) Ltd. adheres to.
© 2024 Raymond James Ltd. All rights reserved. Member IIROC / CIPF | Privacy Policy | Web Use Agreement
