Mama Always Said: Mid-Month Stretch November 2022
November MMS – Mama Said
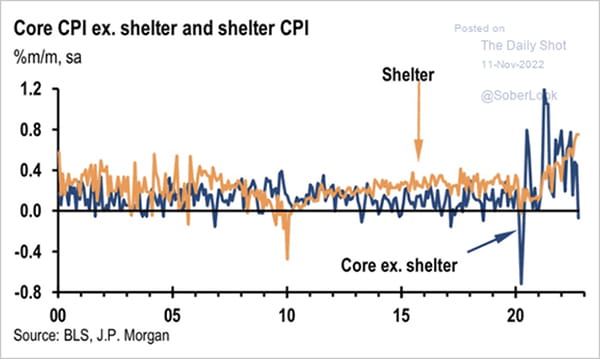
Mother said, "all good things come to those that wait." Well, we have patiently waited for November 10, the day we finally received confirmation that inflation peaked and the trend appears to be lower.
US CPI came in below market expectations, with many components showing no monthly increase (in some cases, a monthly decline). Shelter costs remain sticky, but real-time data suggests better days are ahead.
Sweet Justice – CPI Delivers
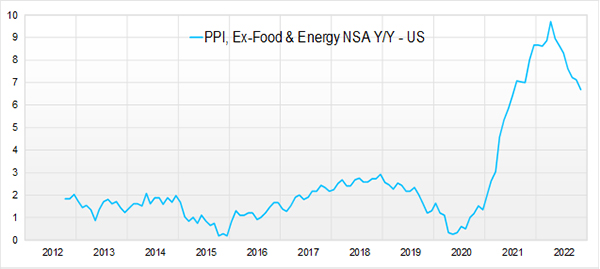
This week, the Producer Prices Index (PPI) further supported the cooling inflation narrative. PPI measures the average change over time in the selling prices received by domestic producers for their output.
PPI has been steadily declining since June, and the October release continued the trend.
Mama's Got Your Back – PPI Delivers Again
Source: FactSet
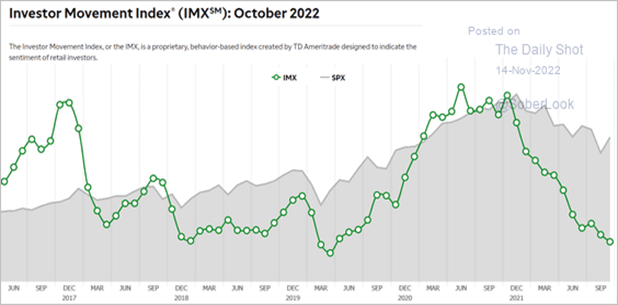
We have noted that sentiment and positioning have been overly pessimistic.
We have illustrated this in numerous ways in the past, but here we show the Investor Movement Index (IMX). The IMX uses data from one of the US's largest online investment communities to give a snapshot of investor sentiment. A low reading indicates investors were net sellers of equities.
Retail investors were risk off going into November, and all it would take was one positive headline to unleash a monster rally.
Retail Investors - Buy High, Sell Low
Stars Aligned for Now
Markets jumped on the inflation print; the S&P/TSX posted a daily gain of 3.3%, the S&P 500 5.5% and the tech-heavy NASDAQ surged 7%, one of its best daily advances ever!
The positive inflation data kick-started a string of positive developments that provided greater certainty for market participants.
The conclusion of the mid-term elections, a marginal improvement in China/US relations, a marginal softening in China's COVID policy and advancement by Ukrainians provided markets with much-needed positive news as we head into the seasonally strong period for equities.
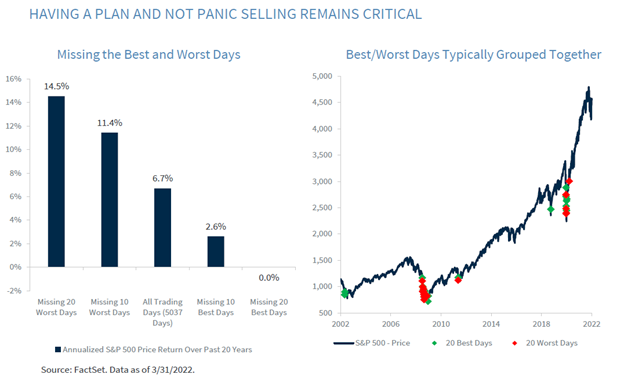
During our last few webinars, we stressed the importance of remaining invested, given that missing some of the best days in the market can significantly impact your overall return.
As illustrated below, if you stayed fully invested over the past 20 years, your annualized return was ~7%.
However, if you tried to time the market, failed to reinvest at the right time and missed the ten best trading days, your annualized return was ~3%.
If you were really paralyzed and failed to be in the market for the best 20 trading days, your return was ZERO!
It's time in the market, not timing the market, that benefits the patient investor.
Doing Nothing is Sometimes Doing Something
Long Live the Bull…
Are we in a new bull market? Boy, we would love to make that statement. However, our current view is that we are likely experiencing a bear market rally as we must contend with the impacts of higher interest rates (which are only now starting to impact the real economy) and slower global economic growth in 2023.
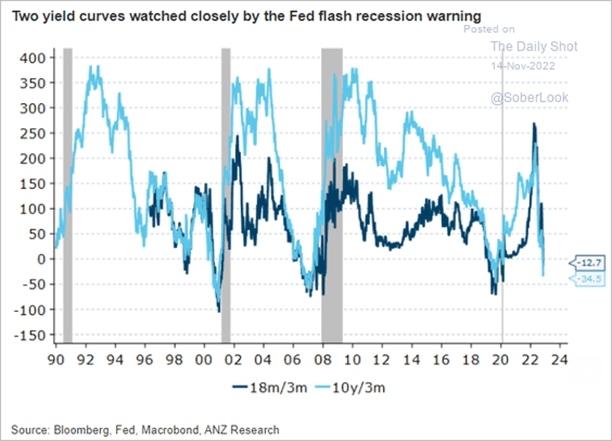
The yield curve, a relatively accurate indicator of recession, is flashing red. We must listen to the market and respect what it is tells us – a recession in 2023 is a probable scenario.
However, what kind of recession will it be when the consumer is sitting trillions of savings, and the labour market has been remarkably resilient?
If the last two years have taught us anything, it is that the economic distortions created by COVID, and the response to COVID, make forecasting incredibly challenging.
US Yield Curve Flashing Red
Where do we Stand
As we begin to turn our focus to the year ahead, we formulate a few potential scenarios:
- Thread the Needle. In this scenario, the Fed accomplishes a soft landing, inflation returns near target (we think the market would accept 3-4% in 2023 even though the Fed's target is 2%), and interest rates level off.
- A US recession appears to be the most logical conclusion at this point, but it could look very different than your garden-variety recession. Perhaps it is a rolling recession throughout different parts of the economy and at different times.
- Slow or no economic growth while inflation remains hot. Geopolitical events would need to impact supply chains and commodities, contributing to inflation. The Fed would need to continue to raise interest rates resulting in a hard landing.
- Not many are discussing this potential scenario, but assuming a calm geopolitical environment and a recession, we could envision significant downward pressure on prices. The good news is the Fed has plenty of ammunition to cut interest rates to counter this potential threat.
For you stats junkies out there, assigning probabilities to the above scenarios will improve over time. As explained by Bayes Theorem, "posterior probability is the revised probability of an event occurring after taking into consideration the new information. Posterior probability is calculated by updating the prior probability using Bayes' theorem. In statistical terms, the posterior probability is the probability of event A occurring given that event B has occurred."
Or, more simply, time will tell.
Portfolios
We are now fully tactically invested after allocating to equities and bonds in October and following confirmation on the inflation front. Below we highlight the recent additions to the portfolios:
- Going Loonie for the Loonie. The portfolios have benefitted from the strong US dollar for much of 2022. Still, we believed the dollar looked overextended and vulnerable to a pullback, particularly if US inflation data confirmed our forecast. As such, we sold dollars to buy the loonie, a trade that has worked in our favour in a relatively short period.
- Added to Home Depot (HD-US), given the stock was trading at a significant discount to its historical valuation levels.
- We added to Brookfield Asset Management (BAM.A-CA) and introduced two new financial holdings – Intact Financial (IFC-CA) and Bank of Nova Scotia (BNS-CA) picking up both yield and value.
- We added iShares S&P/TSX capped Energy ETF (XEG-CA) to introduce broad E&P exposure to the portfolio. We believe several factors support oil prices stabilizing in this range and see XEG as a diversified way to gain exposure.
- We introduced another E&C to the portfolio – Stantec (STN-CA). STN is well-positioned for significant US public sector spending measures. US public sector demand is expected to ramp up over the next 12-18 months as projects funded by the significant new spending measures materialize.
- We added to Cadence Design Systems (CDNS-US). We like the software provider for their exposure to a secular growth industry (semiconductors) without the cyclicality and earnings variability often experienced by semiconductors.
- Real Estate. We added to Canadian Apartment REIT (CAR.UN-CA), given that it is trading at a significant discount to NAV. We believe Canadian interest rates are near their peak, which should put a bottom in for rate-sensitive sectors.
- Utilities. We added to Fortis (FTS-CA) for similar reasons for adding to CAR.UN.
- We added to RP Strategic Income Plus, PH&N High Yield and introduced a new manager, CI Alternative Diversified Opportunities.
Broadly, these trades picked up yield and value. We anticipate markets can continue to rally into year-end, at which point we will reevaluate our allocation in conjunction with our 2023 outlook.
Website legal disclaimers
Raymond James Ltd. is an indirect wholly-owned subsidiary of Raymond James Financial, Inc.
Securities-related products and services are offered through Raymond James Ltd., member Canadian Investor Protection Fund.
Insurance products and services are offered through Raymond James Financial Planning Ltd, which is not a member Canadian Investor Protection Fund.
Raymond James Trust Services are offered by Raymond James Trust (Canada) in the provinces of British Columbia, Alberta, Saskatchewan, and Ontario, and by Raymond James Trust (Québec) Ltd. in the province of Québec. Both entities are wholly owned subsidiaries of Raymond James Ltd. Trust Services are not covered by the Canadian Investor Protection Fund. Use of the Raymond James Ltd. website is governed by the Web Use Agreement | Client Concerns.
Raymond James (USA) Ltd. All rights reserved.
Raymond James (USA) Ltd. advisors may only conduct business with residents of the states and/or jurisdictions in which they are properly registered. Investors outside the United States are subject to securities and tax regulations within their applicable jurisdictions that are not addressed on this website.
Raymond James (USA) Ltd. is a member of FINRA/SIPC.
![]()
This website may provide links to other internet sites for convenience of users. Raymond James (USA) Ltd. is not responsible for the availability of content of these websites, nor does the firm endorse, warrant or guarantee the products, services, or information described or offered by these other internet sites. Users cannot assume that these websites will abide by the same Privacy Policy that Raymond James (USA) Ltd. adheres to.
© 2024 Raymond James Ltd. All rights reserved. Member IIROC / CIPF | Privacy Policy | Web Use Agreement
