Let There Be Light: March Newsletter
It's colourless, odourless and cosmic abundant, but rare on Earth. It creates an unmistakable bright reddish-orange light, and despite its inert characteristics, it has the potential to be highly disruptive to the global supply chain. What is this mysterious element, you may ask? You guessed it, neon gas.
Ukraine is a largest producer of neon gas, a critical input used by lasers for the semiconductor industry. While the industry has struggled to meet demand for chips over the past two years, the Ukraine conflict has the potential to exacerbate semiconductor shortages, particularly if the situation escalates.
The availability of semiconductors is a key driver for consumer goods. Giving companies’ comments about robust order books and long wait times owing to pent-up demand, any further supply chain issues will negatively impact economic activity.
You may wonder why we're not concerned about potential disruptions facing the neon sign industry. Well, that is because neon signs, unlike the name suggests, use more common gases such as hydrogen (red), helium (yellow), carbon dioxide (white), and mercury (blue) rather than neon.
We hold four semiconductor companies – Qualcomm, Microchip, Micron and Nivida – that provide exposures to separate end markets. The industry has been playing catch-up by putting inventory in place, but we continue to monitor how potential supply disruptions may impact each company.
Historical Conflicts and the Market
The events unfolding half a world away are unsettling, and our thoughts are with those that are needlessly suffering from an unjust war in Ukraine.
Many possible scenarios may occur over the next several weeks. While we're not in the business of predicting geopolitical events, we are in the business of identifying risks and insulating portfolios to withstand heightened periods of uncertainty.
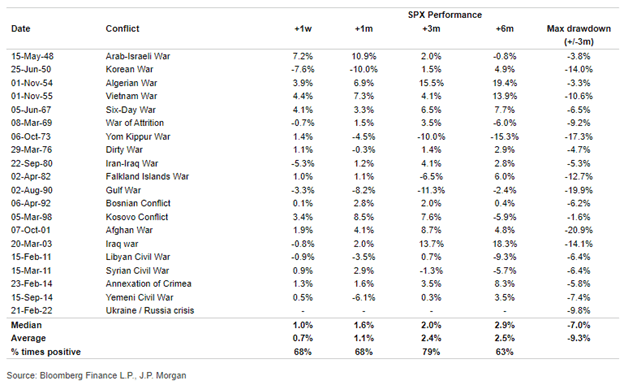
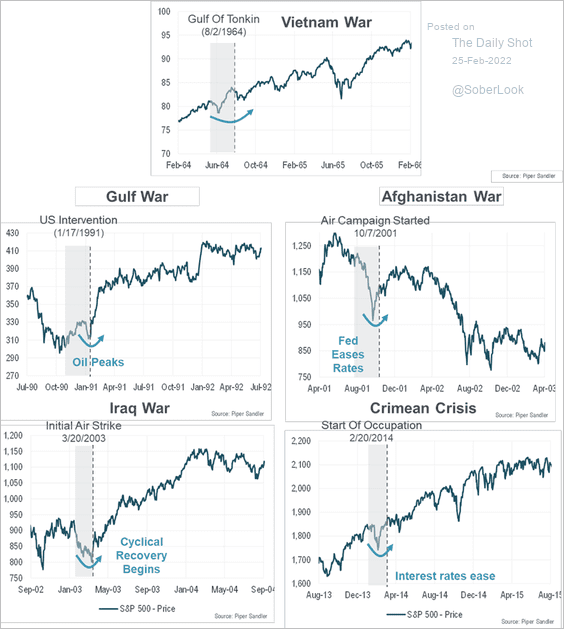
As we discussed during our quarterly webinar, markets historically look past military conflicts. If conflict remains contained in the Ukraine, we believe the markets will follow this historical pattern.
On average, the S&P 500 experiences a ~10% loss around the event, but past localized geopolitical conflicts almost always ended up being a buying opportunity, with markets delivering positive returns over a 3-6 months time frame.
We continually monitor the situation to determine if this time is different, but we know the risk of jumping to that conclusion.
Historical Conflict and S&P Performance
Inflation and Interest Rates
The US economy is strong, as evident by Q4’s GDP 5.6% year-on-year growth. There is more than enough evidence that suggests the US economy can handle higher interest rates. However, the Ukraine/Russia conflict complicates the Fed's tightening cycle by mudding the growth and inflation outlook.
Russia is a significant export of oil and other commodities used in industrial applications. Besides the neon gas situation, Ukraine is a significant exporter of soft commodities. The conflict can potentially exacerbate current inflationary pressures if left unchecked.
For instance, WTI oil prices in the ~$150/bbl range may risk choking off growth and causing a recession. However, the cure to high oil prices is high oil prices, meaning higher prices will incent more supply which will inevitably put downward pressure on price.
We can point to a few supply relief valves that may help keep prices below levels that may negatively impact economic growth:
- OPEC may increase oil production
- The US may increase oil and gas production
- US/Iran nuclear deal may unlock additional barrels of oil for global consumption
- An improved US/China relation may see the rolling back of some tariffs
- The release of strategic oil reserves (the US and its allies are discussing a coordinated release of about 60 mln barrels)
If the supply side, event-driven inflationary pressures cannot be contained, recession risks increase. This leaves the Fed in a tough spot where they must navigate two opposing forces – slower growth and high inflation.
Slower growth implies the Fed should hike less aggressively, while persistently high inflation suggests a more aggressive path.
The Fed will begin its hiking cycle this month (March 15-16 meeting). However, as stated above, the Fed is stuck between a rock and a hard place.
Bottom line: We anticipated a more volatile year as monetary stimulus became less supportive. We are in the camp that the interest rate path will be slow and steady amid inflationary pressure moderating later this year. But more importantly, the companies we own (and seek to hold) have successfully adjusted to higher prices by either passing them on to the consumer (pricing power) or managing costs/found efficiencies to maintain margins and earnings.
Portfolio Positioning
We have shared our view that 2022 would be a more challenging year for equity markets due to the removal of monetary stimulus. The conflict in Ukraine has added an additional element of uncertainty to the outlook, but as history suggests, the market can handle a "normal" geopolitical conflict.
Given our outlook, we have actively been de-risking the portfolios by increasing cash and moving towards more defensive sectors and securities. Our cash levels stood at ~15%, but we did execute some dipping buying late February, bringing cash levels to ~13%. Notable trades include:
- Consumer discretionary: we added to Capri Holdings (CPRI-US)
- Consumer staples: we added to Coca-Cola (KO-US)
- Financials: we initiated a new position in Chubb (CB-US). Chubb is the world's largest publicly traded property and casualty (P&C), which engages in the provision of commercial and personal property and casualty insurance, personal accident and accident and health (A&H), reinsurance, and life insurance. The insurer is benefiting from pricing momentum as the industry is enjoying the highest premiums increases since 2003.
- Industrials: we initiated a position in Emerson Electric (EMR-US). EMR is a global technology and engineering company that provides innovative solutions for customers in industrial, commercial and residential markets.
- Health care: we added to CVS Health (CVS-US) and Abbott Laboratories (ABT-US)
- Utilities: we switched from Algonquin Power (AQN-CA) to Fortis (FTS-CA)
- Real estate: we initiated a new position in CBRE Group (CBRE-US). CBRE provides commercial real estate and investment services and is benefiting from elevated transaction volumes due to historically low-interest rates, increased availability of capital, strong valuations, and an upbeat economic environment. As the largest player in nearly every category it competes, CBRE is well-positioned to benefit from the macro environment.
- Materials: we initiated a new position in Sealed Air (SEE-US). SEE is a provider of packaging automation equipment and, benefiting from the pandemic, has accelerating automation trends across protein, industrial, and e-commerce.
In addition to the above, we took profits on WSP Global, Costco, Tricon, Qualcomm and sold Alibaba, Blackrock and Meta Platforms. Please feel free to contact us if you want our thoughts on these transactions.
Charts of Interest
Past periods of geopolitical events and market performance.
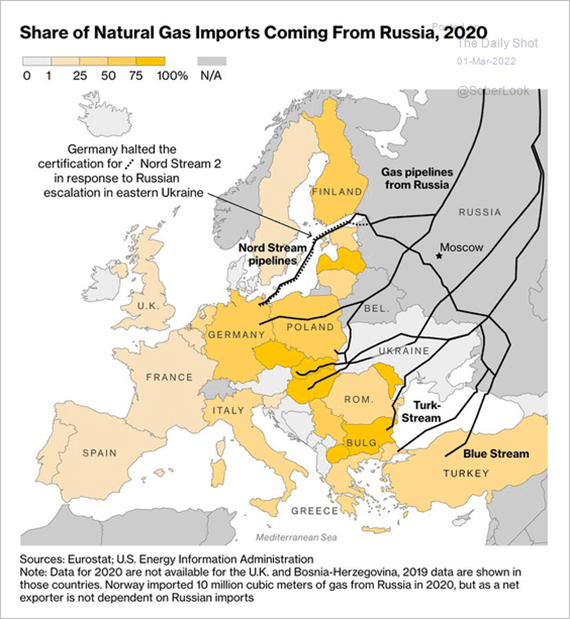
Europe's reliance on Russian gas puts the union in a difficult spot. Share of natural gas imports coming from Russia.
China is Russia's largest trading partner, followed by the Netherlands.

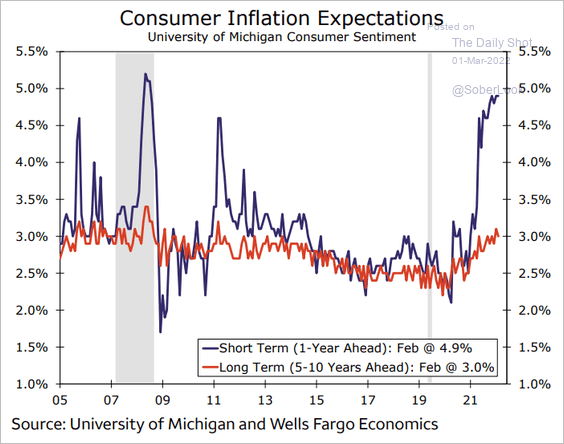
Despite inflation hitting multi-decade highs, long-run inflation expectations remain relatively moderate.
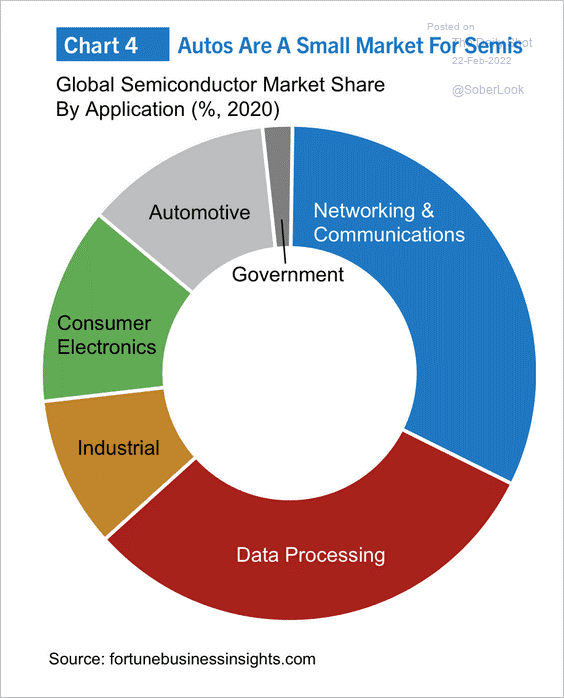
Semis make the world-go-round; the market for semiconductors.
Tax Package Information
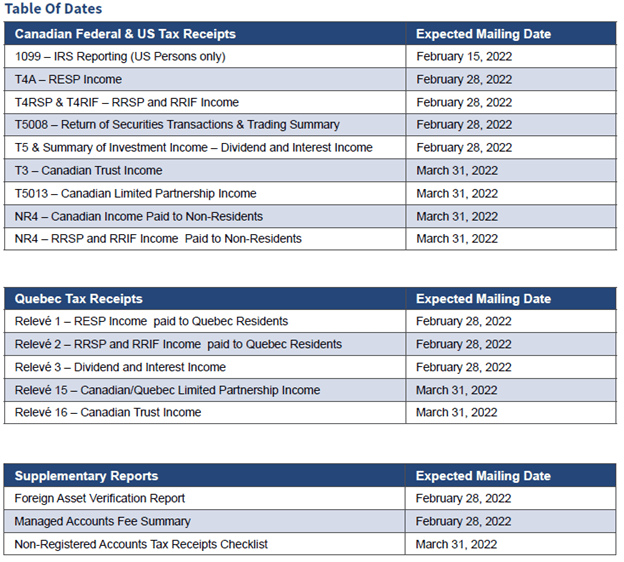
Now that we are entering the 2021 tax season, we would like to advise you that all relevant tax documents are being generated and will be sent out according to the table below. This schedule was also included with your December statements.
Trading Disposition Summaries, also known as Gain/Loss Reports will be generated the first week of April. The reason that these reports are ready later into the tax year is to account for the Return of Capital Adjustments. These adjustments are reported by each individual company and our back office manually records these adjustments in order to have the reports as accurate as possible. We ask for your patience until these reports are ready. They will be mailed out and available electronically.
Lastly, a separate Tax Receipt Checklist will be published and sent out mid-March. The checklist will include any applicable Raymond James tax documents as well as mutual fund company T3s and/or T5s which are mailed to you directly.
TAX-FREE SAVINGS ACCOUNT
- Annual contribution limit for 2022 is $6,000, and the cumulative total as of 2022 is $81,500.
- Investment income generated within a TFSA is not taxable.
- No deadline for contributions.
- To check your TFSA contribution room, please follow the link to log on to CRA’s My Account
- Please note, not all contributions or withdrawals may have been recorded with the CRA in a timely manner. If you have multiple TFSAs or past withdrawals, we suggest double checking the contribution room against your own records.
To request a contribution, please email us at cadence@raymondjames.ca.
Website legal disclaimers
Raymond James Ltd. is an indirect wholly-owned subsidiary of Raymond James Financial, Inc.
Securities-related products and services are offered through Raymond James Ltd., member Canadian Investor Protection Fund.
Insurance products and services are offered through Raymond James Financial Planning Ltd, which is not a member Canadian Investor Protection Fund.
Raymond James Trust Services are offered by Raymond James Trust (Canada) in the provinces of British Columbia, Alberta, Saskatchewan, and Ontario, and by Raymond James Trust (Québec) Ltd. in the province of Québec. Both entities are wholly owned subsidiaries of Raymond James Ltd. Trust Services are not covered by the Canadian Investor Protection Fund. Use of the Raymond James Ltd. website is governed by the Web Use Agreement | Client Concerns.
Raymond James (USA) Ltd. All rights reserved.
Raymond James (USA) Ltd. advisors may only conduct business with residents of the states and/or jurisdictions in which they are properly registered. Investors outside the United States are subject to securities and tax regulations within their applicable jurisdictions that are not addressed on this website.
Raymond James (USA) Ltd. is a member of FINRA/SIPC.
![]()
This website may provide links to other internet sites for convenience of users. Raymond James (USA) Ltd. is not responsible for the availability of content of these websites, nor does the firm endorse, warrant or guarantee the products, services, or information described or offered by these other internet sites. Users cannot assume that these websites will abide by the same Privacy Policy that Raymond James (USA) Ltd. adheres to.
© 2024 Raymond James Ltd. All rights reserved. Member IIROC / CIPF | Privacy Policy | Web Use Agreement
